
Visualise Your Wireless Network Performance with Professional Wi-Fi Heatmaps
Professional Wi-Fi heatmaps provide a visual representation of how your wireless network performs across your building. Created as part of a professional Wi-Fi survey, they reveal coverage, signal strength, interference, capacity and roaming performance, helping you identify hidden issues before they impact your users.
Whether you’re planning a new wireless deployment, expanding your existing network or investigating poor Wi-Fi performance, our heatmaps provide the insight needed to optimise your network with confidence.
What is a Wi-Fi Heatmap?
A Wi-Fi heatmap is a colour-coded visual map showing how your wireless network performs throughout your building. Using professional survey equipment, our engineers collect thousands of wireless measurements before converting the data into detailed maps that clearly illustrate coverage, signal quality and network performance.
Unlike free Wi-Fi analyser apps, professional heatmaps provide an accurate picture of how users actually experience your network. They highlight issues such as dead zones, poor roaming, interference and capacity limitations that aren’t immediately obvious during day-to-day use.
One of the biggest misconceptions is that a strong signal automatically means good Wi-Fi. In reality, many of the networks we survey already have excellent signal strength. The real problems are often channel congestion, interference or poor access point placement, issues that only become visible through a professional Wi-Fi survey and heatmap.
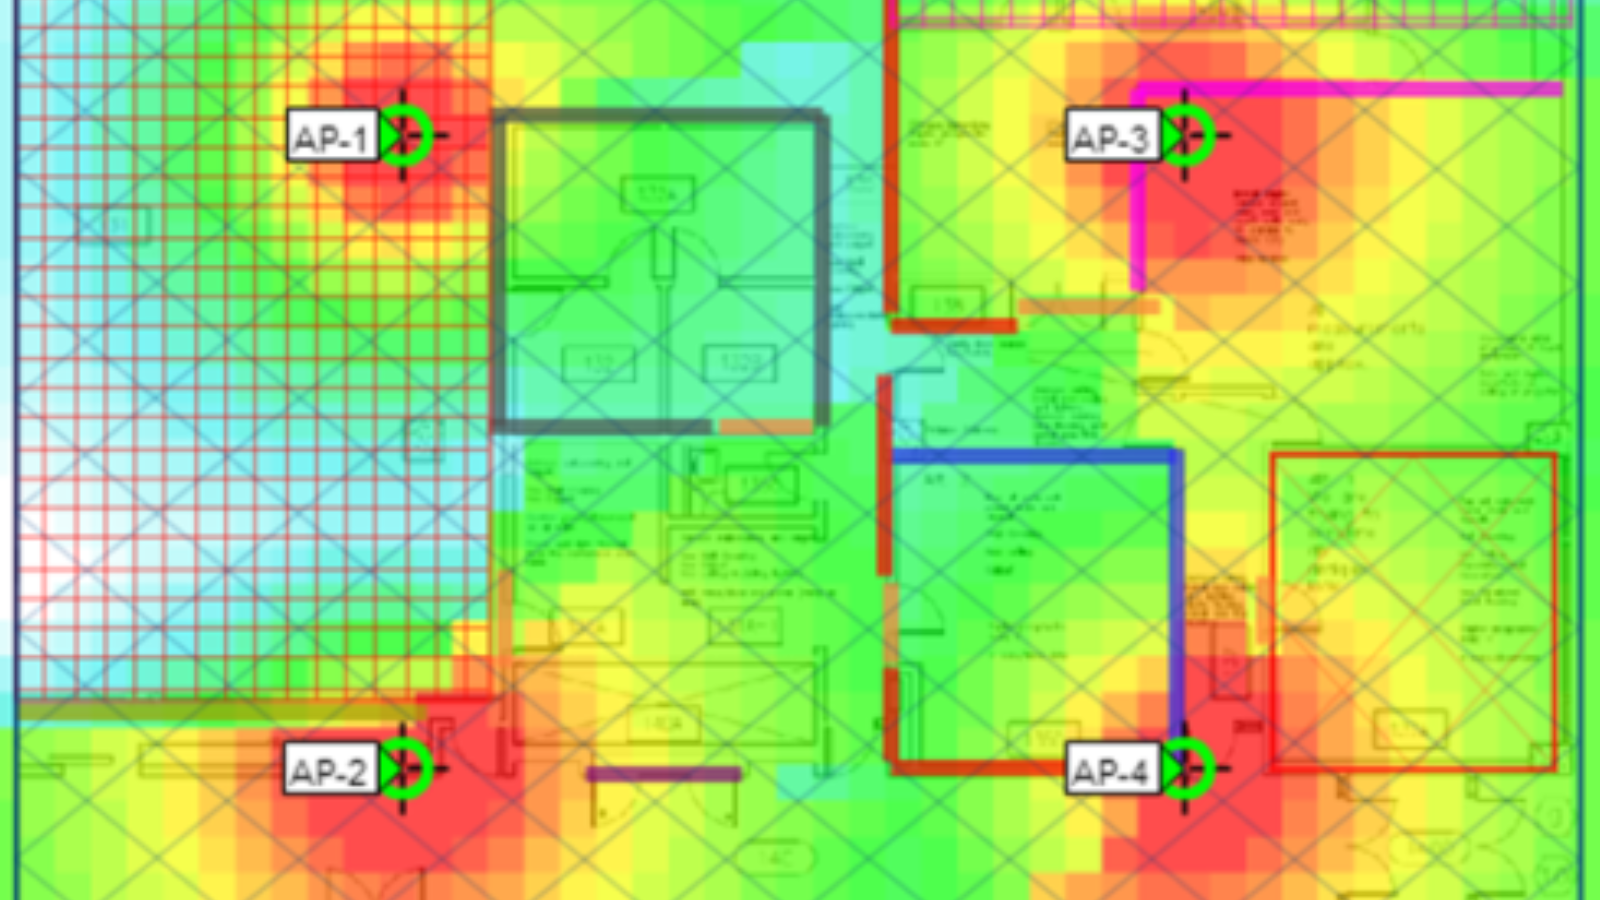
What can a Wi-Fi heatmap show?
Signal Strength (RSSI)
Shows how strong your Wi-Fi signal is throughout the building, helping identify coverage gaps and dead zones where devices may struggle to connect.
Signal-to-Noise Ratio (SNR)
Measures signal quality by comparing the Wi-Fi signal against background radio frequency (RF) noise. Poor SNR often causes unreliable connections despite having acceptable signal strength.
Channel Interference
Highlights areas where neighbouring wireless networks or overlapping access points compete for airtime, reducing network performance.
One of the most common issues we identify during commercial Wi-Fi surveys is excessive channel overlap caused by poorly positioned access points.
Channel Utilisation
Shows how busy each wireless channel is.
A network may have excellent coverage but still perform poorly if too many devices are competing for the same channel.
Roaming Performance
Illustrates how devices move between access points as users walk around your building.
This is particularly important in warehouses, hospitals, offices and environments using voice applications or handheld devices.
Capacity Planning
Shows whether your wireless network has enough capacity to support the number of users and devices expected within each area.
Essential for schools, hotels, conference centres and other high-density environments.
Why are Wi-Fi heatmaps important?
Without accurate survey data, wireless networks are often designed using assumptions rather than evidence.
Professional Wi-Fi heatmaps help businesses:
🔹 Identify dead zones and weak coverage
🔹 Detect RF interference
🔹 Reduce channel congestion
🔹 Improve roaming performance
🔹 Optimise access point placement
🔹 Increase wireless capacity
🔹 Support high-density environments
🔹 Avoid unnecessary hardware costs
Rather than simply installing more access points, heatmaps ensure every recommendation is based on measured performance and real-world data.
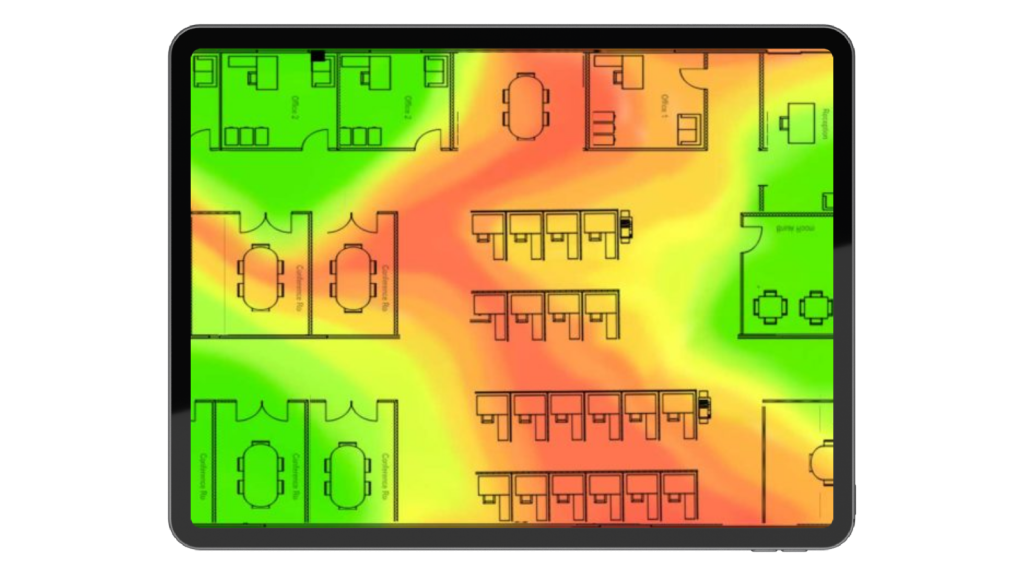
How to read a Wi-Fi heatmap
Green
Excellent wireless coverage
Yellow
Good coverage suitable for most applications
Orange
Coverage beginning to weaken
Red
Poor signal that may affect performance
How we create Wi-Fi heatmaps
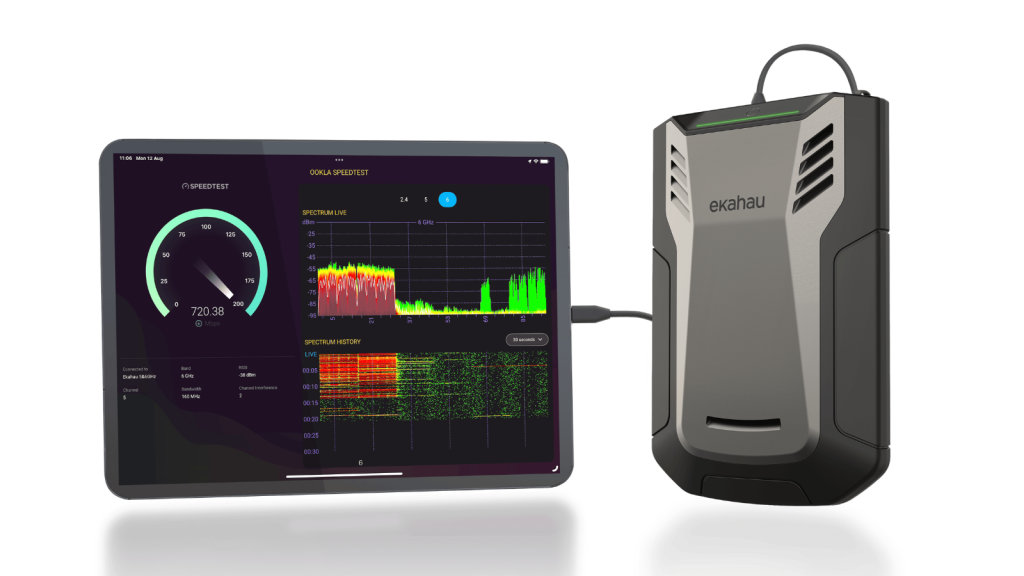
Every heatmap begins with a professional wireless survey using Ekahau AI Pro and Ekahau Sidekick 2.
Our process includes:
🔹 Reviewing your building layout and wireless requirements
🔹 Collecting thousands of wireless measurements throughout your site
🔹 Analysing coverage, interference, roaming and capacity
🔹 Producing detailed Wi-Fi heatmaps
🔹 Providing practical recommendations to improve network performance
Every heatmap is interpreted by an experienced wireless engineer, ensuring you receive practical recommendations rather than simply a collection of charts.
Before & After

Before
🔹 Poor roaming
🔹 Dead zones
🔹 Slow Teams calls
🔹 Handheld scanner dropouts
🔹 Channel congestion
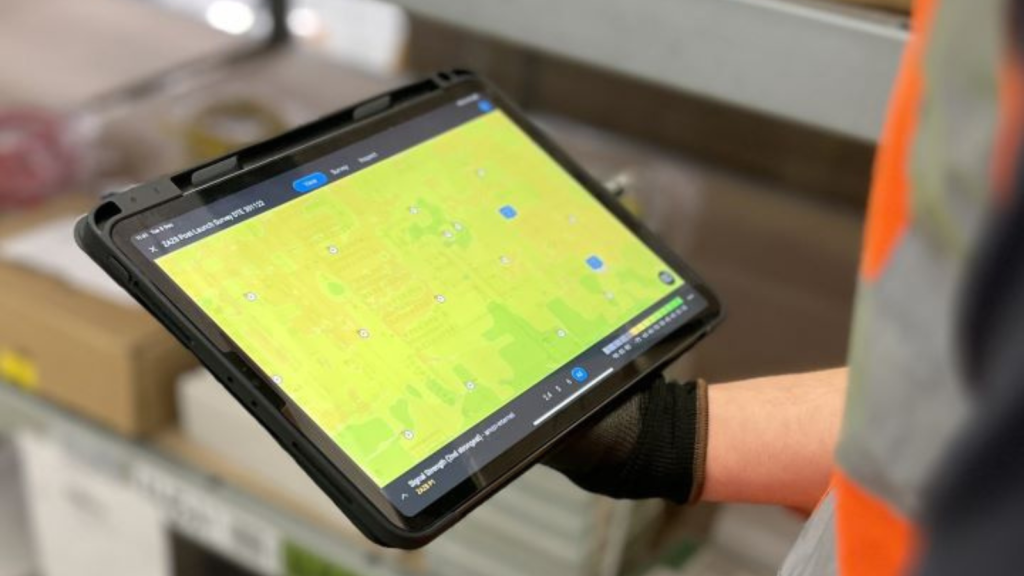
After
🔹 Reliable wireless coverage
🔹 Improved roaming
🔹 faster application performance
🔹 Optimised access point placement
🔹 Better user experience
What you'll receive
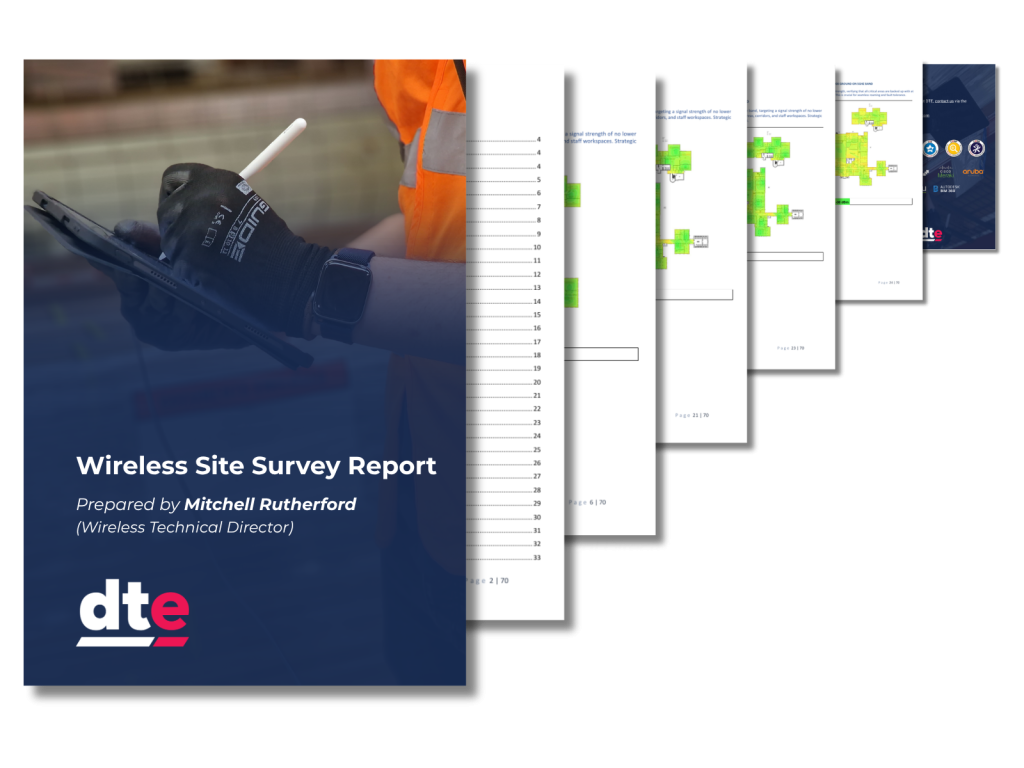
Following your survey, you’ll receive a detailed report including:
🔹 Wi-Fi coverage heatmaps
🔹 Signal strength analysis
🔹 SNR and interference maps
🔹 Coverage and capacity recommendations
🔹 Access point placement guidance
🔹 Prioritised improvement plan
Every recommendation is backed by measured data, giving you confidence to optimise your wireless network without unnecessary investment.
Why choose DTE?
With over 20 years’ networking experience, DTE helps businesses across the UK design, optimise and troubleshoot enterprise wireless networks.
Using Ekahau AI Pro and Ekahau Sidekick 2, our certified engineers create accurate Wi-Fi heatmaps that identify real-world performance issues, not just coverage gaps. Every survey includes practical, vendor-neutral recommendations tailored to your environment, whether it’s an office, warehouse, school, hotel or manufacturing facility.
FAQ
A Wi-Fi heatmap is a visual representation of wireless coverage and performance across a building, created using measurements collected during a professional Wi-Fi survey.
Heatmaps can display signal strength, signal quality (SNR), interference, channel utilisation, roaming performance and network capacity.
Yes. Heatmaps clearly highlight areas with weak or no wireless coverage, making it easy to identify where improvements are needed.
Yes. Professional heatmaps can reveal interference from neighbouring networks, overlapping channels and other RF sources affecting performance.
Absolutely. Predictive heatmaps allow wireless networks to be designed before installation using digital floor plans.
Strong signal doesn't always mean good performance. Many Wi-Fi issues are caused by congestion, interference or insufficient capacity rather than weak coverage.
Yes. We use Ekahau AI Pro and Ekahau Sidekick 2, the industry standard for enterprise Wi-Fi surveying.

Speak to a Specialist
Provide your details below, email info@dteuro.com or call +44 (0) 845 658 8810.