Your wireless network appears to be working, yet staff continue to complain about poor connectivity.
Microsoft Teams calls freeze in meeting rooms. Warehouse scanners lose connection halfway down an aisle. Employees experience dead zones in areas that should have strong coverage, while adding more wireless access points seems to make little difference.
If this sounds familiar, you’re not alone.
Many businesses assume these problems are caused by slow broadband or ageing equipment. In reality, the issue often lies within the wireless environment itself.
This is where Wi-Fi heat mapping becomes invaluable.
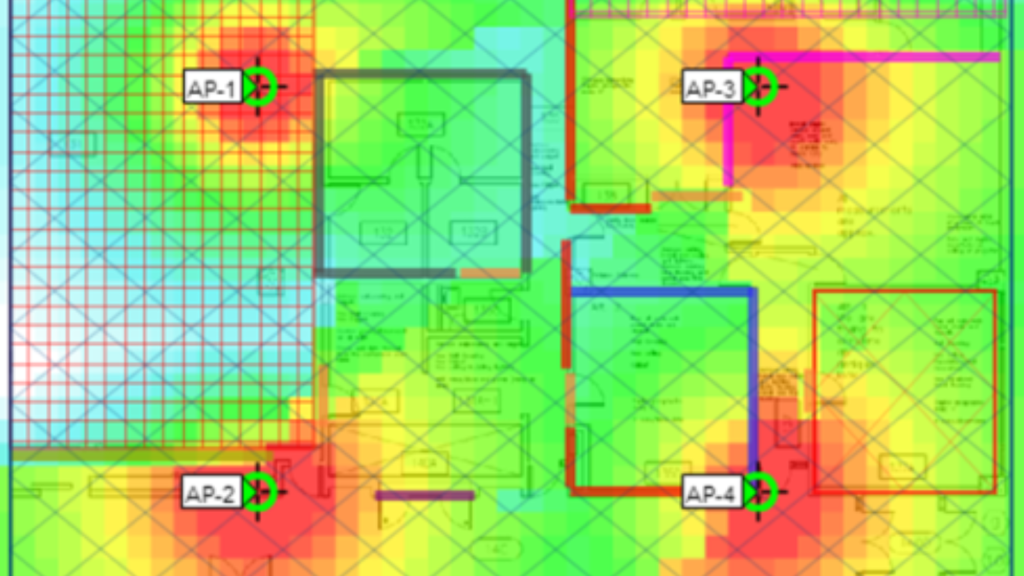
Using professional RF survey software, our engineers create detailed visual heat maps that reveal coverage gaps, interference, roaming issues and capacity problems that are impossible to identify through guesswork alone.
Heat mapping forms an essential part of a professional WiFi Survey, helping businesses optimise wireless performance before connectivity issues begin affecting productivity.
What is Wi-Fi heat mapping?
Think of Wi-Fi heat mapping as creating a visual blueprint of your wireless network.
Rather than simply checking whether a device can connect, professional survey equipment records thousands of wireless measurements as engineers move throughout your premises.
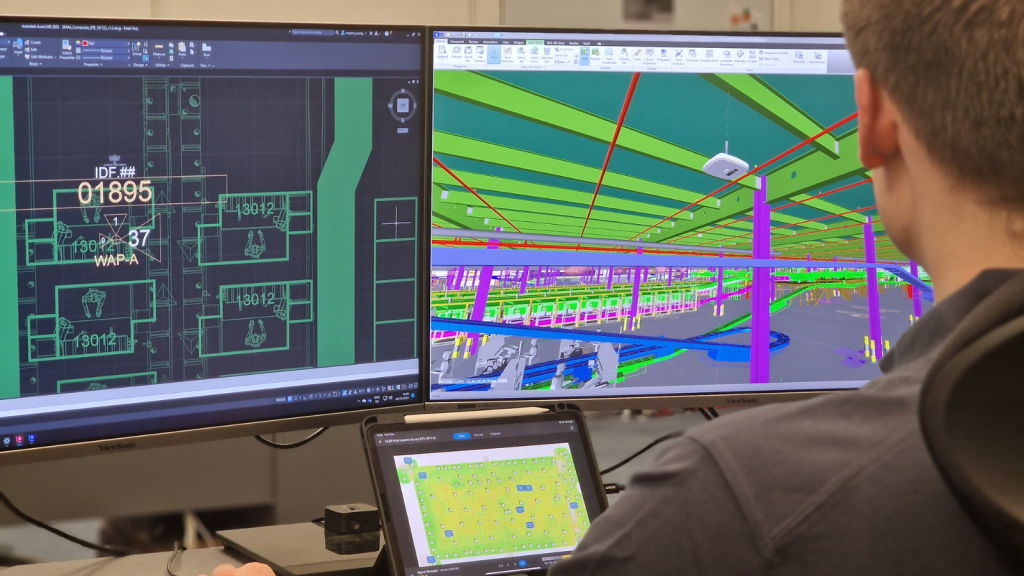
The collected data is plotted onto a digital floor plan, producing colour-coded heat maps that show exactly how your wireless network performs in real operating conditions.
Depending on the survey, heat maps can display:
🔹 Signal strength (RSSI)
🔹 Signal-to-noise ratio (SNR)
🔹 Wireless coverage
🔹 Access point overlap
🔹 Channel utilisation
🔹 RF interference
🔹 Client roaming performance
🔹 Capacity
🔹 Data rates
Instead of relying on assumptions, you gain a complete picture of how your wireless infrastructure behaves throughout the building.

Why is WiFi heat mapping important?
Wireless signals rarely travel as expected.
Every building contains physical obstacles that influence how radio frequency (RF) signals propagate.
Common examples include:
🔹 Concrete walls
🔹 Steel warehouse racking
🔹 Glass partitions
🔹 Machinery
🔹 Lift shafts
🔹 Shelving
🔹 Office furniture
🔹 Neighbouring wireless networks
These obstacles can weaken signals, create interference or prevent devices from roaming correctly between access points.
Without heat mapping, many organisations respond by installing additional wireless access points.
Unfortunately, more access points don’t always improve performance.
Poorly positioned hardware can actually increase interference, create channel congestion and reduce overall wireless efficiency.
A professional WiFi survey identifies the real cause of wireless issues before changes are made, helping businesses invest in the right solution rather than simply adding more equipment.
How does Wi-Fi heat mapping work?
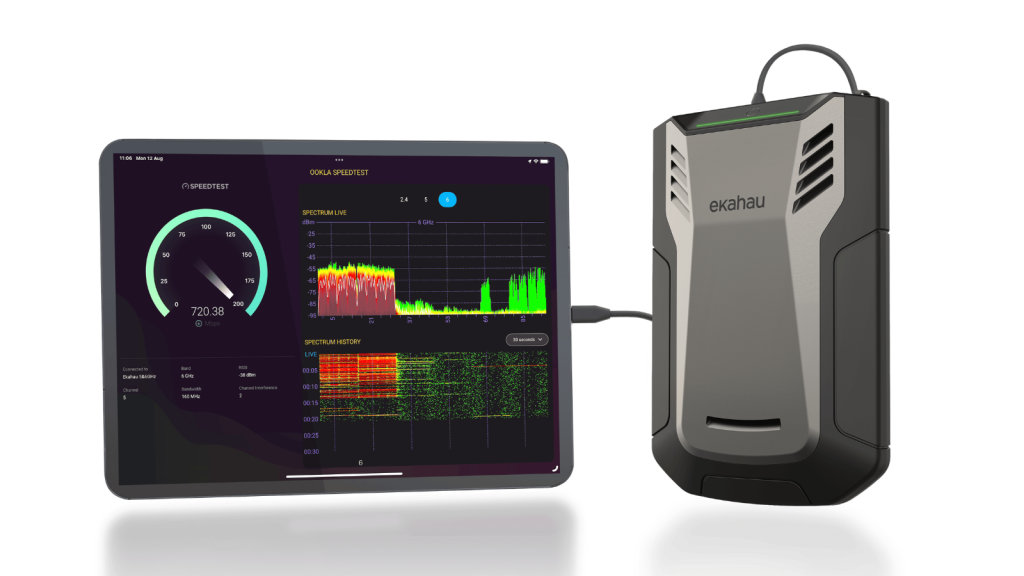
During an on-site WiFi site survey, engineers walk throughout the building carrying specialist survey equipment such as Ekahau AI Pro and Ekahau Sidekick 2.
As they move through offices, warehouses, production areas and meeting rooms, thousands of wireless measurements are automatically collected.
These include:
🔹 Signal strength
🔹 Signal quality
🔹 RF noise
🔹 Channel utilisation
🔹 Interference
🔹 Roaming performance
🔹 Client connectivity
🔹 Coverage consistency
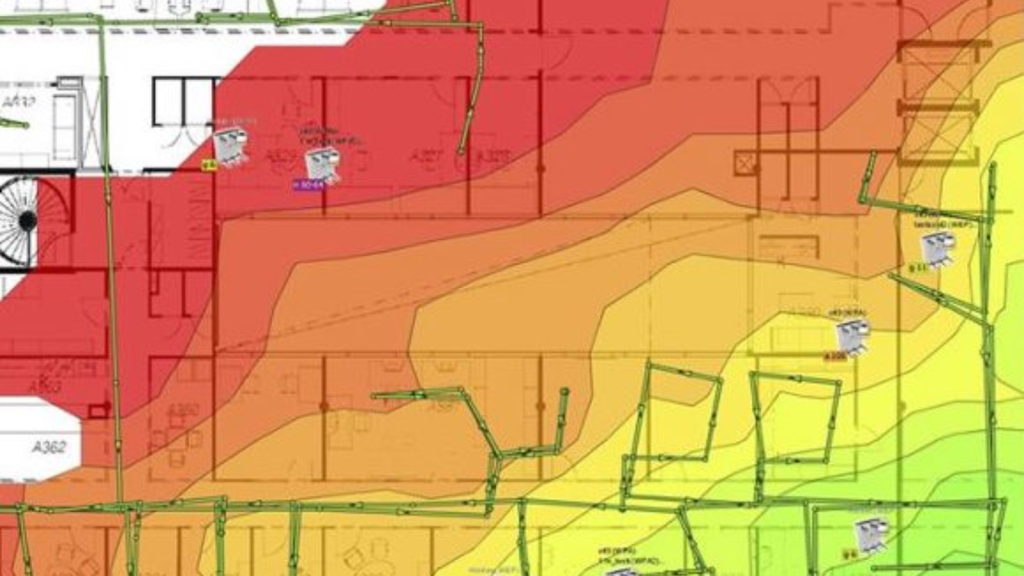
Every measurement is mapped onto your building’s floor plan, creating detailed visual heat maps that accurately represent wireless performance.
Unlike a simple signal strength test, heat mapping provides a comprehensive understanding of how your network behaves under real-world conditions.
Understanding WiFi heat maps
One of the biggest advantages of heat mapping is that complex technical information becomes easy to understand.
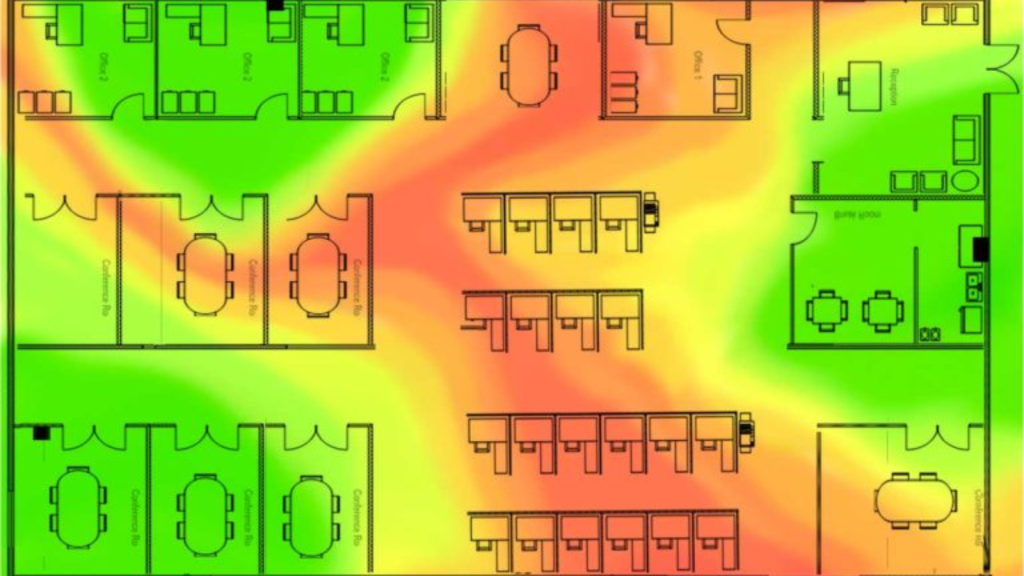
Most wireless heat maps use colours to represent different levels of wireless performance.
Generally:
🟢 Green indicates strong, reliable wireless coverage.
🟡 Yellow highlights areas where performance may begin to reduce.
🟠 Orange identifies marginal coverage that may affect some devices.
🔴 Red highlights poor coverage or complete wireless dead zones.
Different heat maps can also visualise:
🔹 Signal-to-noise ratio
🔹 Channel overlap
🔹 Access point coverage
🔹 RF interference
🔹 Data rates
🔹 Client roaming
🔹 Capacity
These visualisations allow engineers to quickly identify exactly where improvements are required.
What problems can heat mapping identify?
Many wireless issues remain hidden until they begin affecting users.
Professional WiFi heat mapping regularly identifies:
🔹 Coverage gaps
🔹 Dead zones
🔹 Co-channel interference
🔹 Adjacent channel interference
🔹 Poor roaming
🔹 Hidden node problems
🔹 High retry rates
🔹 Overloaded access points
🔹 Incorrect channel planning
🔹 Capacity bottlenecks
🔹 RF shadowing
🔹 Poor antenna positioning
These are issues that traditional network monitoring tools often fail to identify because they cannot visualise how radio signals behave throughout the environment.

Warehouse WiFi presents unique challenges
Warehouses are among the most demanding wireless environments.
Unlike offices, warehouse layouts constantly change.
Stock levels vary.
Steel racking reflects wireless signals.
Forklifts move throughout the building.
Industrial equipment generates interference.
High ceilings alter access point coverage.
As a result, warehouse WiFi networks require specialist design and validation.
A professional WiFi survey helps ensure barcode scanners, Warehouse Management Systems (WMS), vehicle-mounted terminals and voice picking solutions remain connected wherever employees work.
Our Warehouse Wi-Fi vs Office WiFi blog explains why warehouses require a different wireless approach.

Predictive heat mapping vs on-site heat mapping
Heat mapping can be used before or after a wireless network is installed.
Predictive Heat Mapping
A predictive survey uses building plans and RF modelling software to estimate:
🔹 Access point locations
🔹 Expected wireless coverage
🔹 Capacity
🔹 Roaming
🔹 Hardware requirements
This approach is ideal for new buildings, refurbishments and warehouse developments.
On-Site Heat Mapping
Once the wireless network has been installed, engineers carry out an on-site survey to validate how the network performs in real operating conditions.
Comparing predicted performance with actual measurements helps ensure the network delivers the expected results.
Read our related guide: Predictive vs On-Site Wi-Fi Surveys – What’s the Difference?
What will you receive after a professional WiFi survey?
Following a professional survey, you’ll receive far more than a collection of colourful diagrams.
Typical deliverables include:
🔹 Wireless coverage heat maps
🔹 RSSI analysis
🔹 Signal-to-noise ratio reports
🔹 Channel utilisation maps
🔹 Interference analysis
🔹 Access point locations
🔹 Coverage recommendations
🔹 Capacity assessments
🔹 Engineer observations
🔹 Prioritised recommendations for improvement
This allows your IT team to make informed decisions based on measurable data rather than assumptions.

Why businesses choose DTE
At DTE, we combine professional wireless survey technology with decades of enterprise networking experience to help businesses build faster, more reliable wireless networks.
Using Ekahau AI Pro and Ekahau Sidekick 2, our engineers deliver professional WiFi surveys, predictive wireless modelling and detailed RF analysis for offices, warehouses, manufacturing facilities, healthcare organisations and multi-site businesses across the UK.
Whether you’re troubleshooting poor wireless performance, planning a new deployment or validating a recent installation, we’ll provide clear recommendations that improve coverage, capacity and long-term reliability.
If your organisation is experiencing dead zones, poor roaming or unreliable wireless connectivity, learn more about our WiFi Survey services or contact our team to discuss your requirements.
Speak to a Specialist
Provide your details below, email [email protected] or call +44 (0) 845 658 8810.